
HSC Chemistry Syllabus Notes -
Module 8 / Inquiry Question 2
Overview of Week 14 Inquiry Question – How is information about the reactivity and structure of organic compounds obtained?
Learning Objective #1 – Conduct qualitative investigations to test for the presence in organic molecules of the following functional groups:
Carbon–Carbon double bonds
Hydroxyl groups
Carboxylic acids
Learning Objective #2 – Investigate the processes used to analyse the structure of simple organic compounds addressed in the course, including but not limited to:
Proton and Carbon-13 NMR
Mass spectrometry
Infrared spectroscopy
NEW HSC Chemistry Syllabus Video – Analysis of Organic Molecules
Week 15 Homework Questions
Week 15 Curveball Questions
Week 15 Extension Questions
Solutions to Week 15 Questions
Learning Objective #1 - Conduct qualitative investigations to test for the presence in organic molecules of the following functional groups:
- Carbon-Carbon double bonds (Alkenes)
- Hydroxyl groups
- Carboxylic Acids
Carbon-Carbon double bonds (Alkenes)
In this learning objective, we will explore different tests to differentiate alkenes, alcohols and carboxylic acids.
We have already explored the use of bromine water to test for the presence of double bond between carbon atoms in Week 9’s notes (Module 7 – Inquiry Question #2).
However, we will formally re-introduce it here as promised in Week 9.
So, a common test that can be used to differentiate between saturated (alkanes) and unsaturated hydrocarbons (e.g. alkenes) the reaction with bromine water.
Bromine water basically bromine molecule (Br2) being dissolved in water and so it the following reaction:
Br2(aq) + H2O(l) <-> HOBr(aq) + HBr(aq).
By reacting alkenes with bromine water, an addition reaction can take place to break one of the carbon bonds between unsaturated carbon atoms in the alkene.

Procedure:
Step 1: Add 5mL of the solution with unknown functional group.
Step 2: Add 5mL of bromine water solution into the test tube using a dropper.
Step 3: Stopper the test tube and gently shake the test tube to mix the two solutions.
Step 4: Record any colour changes.
NOTE: It is possible that there may be an exam question in regards to the safety precautions of this experiment (and any other experiments). We will have questions about this in this week’s homework and you can check the solutions after you are done to confirm if your answer is correct.
Now you may ask why doesn’t alkanes react with bromine water? Well, it does if the reaction is performed under the presence of ultraviolet light or high temperature.
What happens is that alkanes (does not have double bonds between carbon atoms) will not react with the bromine molecule unless under the presence of high temperature or U.V light. This is because not enough energy is provided to break the C-H bond to allow for substitution reaction.
Comparatively, addition reaction occurring between saturated hydrocarbons like alkenes and alkynes with bromine water does not need as high energy due to lower bond energy of breaking of one of the several C-C in a double bond or triple bond between carbons atoms.
Therefore, the bromine molecule can be incorporated into the alkenes and alkyne molecules via addition reaction at room temperature.
Since bromine has a red-brown colour and the hydrocarbons (e.g. alkane, alkene, alkynes) are colourless, the effect is that when bromine undergoes addition reaction or substitution reaction, there will no longer be bromine molecules in solution. Thus, the addition reaction decolourises the solution from red-brown colour to colourless.
Therefore, to differentiate saturated and unsaturated molecules, bromine water can be used to perform addition reaction under the absence of ultraviolet light (e.g. in a dark room)
Hydroxyl Groups
Moving onto alcohols!
Recall that an alcohol is defined by a molecule that has the OH group as highest priority functional group. It is possible for the R group of the alcohol to have a double bond between carbon atoms. In that case, such alcohol would also decolourise the red-brown bromine water solution!
So, what shall we do to differentiate alkenes and unsaturated alcohols?
Well, we can react alcohols with carboxylic acids to form an ester! So, it’s back to the method of esterification again which we have explored in Module 7. Recall that in esterification, we should also add concentrated sulfuric acid as a dehydrating agent and gently heating the mixture under reflux. After adding sodium hydrogen carbonate to neutralise any excess acid, any ester that is formed would produced a fruity flavour.
NOTE: Tertiary alcohols don’t readily undergo oxidation and thus the ester produced may be minimal about heating after reflux.
NOTE: We have already touched on the method of performing esterification in Week 12’s Notes.
So how can we distinguish between primary, secondary and tertiary alcohols? Well, if you recall from Week 11 Notes, we have explored how we can use the Lucas’ Reagent to differentiate the three types of alcohols. So, feel free to review that section of notes for any necessary revision.
Carboxylic Acid
Lastly, we’re going to explore how we can differentiate carboxylic acid functional group with the previous two functional groups that we mentioned above.
Well, it’s pretty easy. You could just add a unsaturated alcohol to react it with the carboxylic acid under reflux in the presence of a concentrated sulfuric acid. The result is the production of ester with a fruity odour as we have explained earlier.
The procedure of esterification was discussed in Week 12 Notes.
Alternatively, it is possible to react the carboxylic acid (an acid) with sodium hydrogen carbonate (a base) to produce carbon dioxide which we see as bubbles forming, i.e. effervescence.
Chemical equation for the reaction of a generic carboxylic acid with sodium hydrogen carbonate:
2R-COOH + Na2CO3(aq) + 2R-COONa (aq) + CO2(g) + H2O(l)
To test that the gas formed is indeed carbon dioxide, we can pipette 5mL of the solution containing the carbon dioxide and react it with a beaker containing limewater, i.e. Ca(OH)2.
Ca(OH)2(aq) + CO2(g) -> CaCO3(s) + H2O(l)
If the unknown is a carboxylic acid, then the reaction between the solution containing the carbon dioxide with limewater will turn the limewater cloudy due to the precipitate of calcium carbonate (white precipitate).
NOTE: An alcohol is too weak of an acid to react with sodium hydrogen carbonate and so no efferversence (carbon dioxide bubbles) will occur.
Learning Objective #2 - Investigate the processes used to analyse the structure of simple organic compounds addressed in the course including, but not limited to:
- Proton and Carbon-13 NMR
- Mass spectrometry
- Infrared spectroscopy
Proton and Carbon-13 NMR
Proton or 1H-NMR is useful as it allows us to determine the relative position of hydrogen attached to carbon atom and the ratio of hydrogen atoms at unique sites in an unknown molecule’s structure.
We will explore understand more what this definition exactly means as you progress along.
If we combine Proton NMR with UV-Vis Spectroscopy (learnt last week), Mass Spectrometry and Infrared Spectroscopy we can determine the molecular structure and formula of an unknown molecule!
But, first, let’s learn Proton NMR.
In 1H-NMR, it involves placing a molecule that has a NMR active nucleus (or atom) in an NMR spectrometer.
As the name suggests 1H-NMR, involving a hydrogen atom with one proton, must be a NMR active atom.
Recall: A proton is positively charged and a neutron is neutral (no charge), which is effectively a hydrogen nucleus.
In order for an atom to be qualified as NMR active:
The atom’s nucleus needs to have an odd number of proton(s) or
The atom’s nucleus has an odd number of neutron(s) or
The atom’s nucleus has both an odd number of proton and an odd number of neutron
Due to this odd number, the nucleus is essentially a spinning charged particle.
A moving charge particle will generate its own magnetic field.
You do not need to know why this is case as it will lead us into HSC Physics.
From this point toward, we will use the word ‘proton’ and hydrogen nucleus interchangeably.
When there is no external magnetic field interacting with the hydrogen atom’s (created by its nucleus) magnetic field, the spin of the hydrogen nucleus (which is just a proton) can be either in the alpha spin state or the beta spin state.
We will look into this in shortly.
For now, just know that alpha spin state is a state where a proton has lower energy compared to a proton in a beta spin state (higher energy state).
In Proton NMR, the molecule of unknown molecular structure with NMR hydrogen nucleus is placed inside a Proton NMR spectrometer.
A magnetic field will be applied by the NMR spectrometer (applied magnetic field). This applied magnetic field could be coming from strong magnets that are built in the spectrometer. As a result of this, the applied magnetic field from the spectrometer will interact with the magnetic field produced by the hydrogen nucleus (proton).
Thus, due of the interaction between the two magnetic fields, most of these protons that were originally in the beta, higher energy spin state will be converted into the lower-energy, alpha spin state.
You can think about this in terms of a magnet. For instance, the proton can be a magnet as it creates it own magnetic field and, likely all magnetic field lines, they goes from the south pole to north pole.
When the NMR applied a magnetic field, it will cause a ‘repulsion’. Since the applied magnetic field is stronger than the magnetic field of the proton, it will drive most of the protons’ magnetic moment from south to north.
When the proton’s magnetic moment is going from south to north pole, the proton is converted backed into the alpha spin state which is the state of lower energy.
That being said, there will also be protons in the beta spin state.
In order to create resonance, which can be interpreted as similar protons having the same spin states in NMR spectroscopy, and to obtain information about the hydrogen- carbon structure of the unknown molecule, RF (radio frequency) radiation can be supplied by the NMR machine. This allows to conversion of protons in the alpha spin state to the beta spin state.
Radiowaves (RF radiation) is a type of electromagnetic radiation which carries energy. As the radiation strikes the hydrogen atom, energy is transferred to the hydrogen nucleus and it will change the hydrogen nucleus’ alpha spin state (lower energy) to a beta spin state (higher energy).
Depending on the amount of energy required to transform a hydrogen nucleus from the alpha spin state to the beta spin state (i.e. energy created to create resonance), it will correspond to a particular frequency. This is because energy is proportional to frequency, E=Hf where f = frequency.
If we look at the NMR spectra, which is essentially the results displaying the energy difference between the alpha and beta spin states. This energy (frequency) difference between alpha and beta spin state is expressed in terms of chemical shift (Delta symbol) with units of ppm or parts-per-million.
We will explore more about the importance of having the term ‘chemical shift’ measured in ppm soon.
For now, let’s interpret what the peaks depicted in the above simple NMR spectrum diagram mean.
Each peak or signal that the NMR spectrum exhibits represents a unique category of hydrogen atom that is
present in a different electronic environment within our unknown molecule.
A hydrogen atom(s) is chemically equivalent if they belong in the same electronic environment in the unknown molecule.
The video below by Khan Academy does a good job in explaining how you can determine whether a hydrogen atom or proton that are chemically equivalent to another.
There are will be more advanced problems in regards to identifying chemically equivalent protons in this week’s homework questions.
Give them a go! Feel free to check solutions after you made an attempt on those!
Sometimes you may see a peak at zero ppm. This peak is due to the reference molecule (known as TMS) that is used in proton NMR.
The hydrogens in TMS are chemically equivalent. That is, they are all in the same, most shielded electronic environment due to similar electronegativity between the Silicon, Carbon and Hydrogen atoms present in the molecule.
When answering NMR questions, we do not count the TMS’s signal as a signal/peak in the unknown molecule as TMS is not part of the unknown molecule that’s structure we want to determine. It only serves as a reference molecule. Sometimes the question may not depict the NMR peak for the TMS molecule too.
Therefore, we can define chemical shift as the distance at which the signal produced from the proton is from the reference compound’s (e.g. TMS) signal.
Typically the range for 1-NMR chemical shift is from 0 – 10 (but it could go a bit higher). The higher the ppm, the more de-shielded the hydrogen atom category’s environment is.
A more de-shielded electronic environment corresponds to a greater energy (or frequency) required to bring the hydrogen nucleus to resonance (i.e. proton to the beta spin state)
The closer the category of hydrogen atom is to a more electronegative atom, functional group or multiple bond, the de-shielded the proton will be. Therefore, more energy it would be required to bring such category of hydrogen to resonance. So, the signal or peak for such category of hydrogen will appear more downfield in the NMR spectrum.
In depth reasoning:
A hydrogen that is shielded will have electrons that hinder the interaction between the external magnetic field applied by the NMR with the magnetic field generated by the hydrogen atom. Comparatively, the magnetic field of hydrogen atoms that are deshielded will interact more completely with the external magnetic, putting (most) them into the alpha spin state (lower energy spin state). So, in the case of hydrogen atom that are shielded, less energy is required to put them into the beta spin state when radio waves are used compared to hydrogen that are deshielded. This is because the energy difference between the alpha and beta state of hydrogen nucleus is lower for the deshielded proton.
NOTE: 13C NMR has a chemical shift range of much higher than 0-10.
As there are many types of NMR that operate at different frequencies, a standardised value is used known as chemical shift or (Delta symbol) with ppm (parts-per-million) as the units.
Delta (ppm) = distance downfield from TMS (Hz) / operating frequency of the NMR (MHz)
This essentially mean that even though different NMR may operates at different frequencies (FM frequency from FM radiation), by standardising the measurement unit to ppm, they will yield the same chemical shift (ppm) when the same hydrogen electronic environment is measured.
In reality, there may be many more peaks that you may expect when you observe H-NMR diagram which cause it to look really messy. This could be due to many reasons such as electrons’ magnetic field moving through the hydrogen atoms which is beyond the scope of HSC Chemistry.
Another point is that the relative intensity of the peak is proportional to the number of hydrogens belonging
to that electronic environment. The more hydrogens in that electronic environment, the higher that peak’s intensity is relative to others. This essentially means you can compare the relative peak intensities to infer the
ratio of hydrogens between in different electronic environments.
NOTE: The area of under the peak can be used to infer the ratio between hydrogen atoms (or protons) in different electronic environments.
Finally, another point is that a single peak on a proton NMR spectrum can be split depending on the number of neighbouring hydrogen surrounding it!
This is known as spin-spin coupling which we are going to explore now.
Spin-spin coupling
Spin-spin coupling is the governing mechanism to why a signal exhibited by hydrogen atom(s) belonging to the same electronic environment (equivalent hydrogens) may be split.
Let’s have a look at a simple organic molecule with hydrogen in two different electronic environments.
If a proton is in the alpha spin state (aligned with the magnetic field), it will increase the effective magnetic field strength experienced by the neighbouring hydrogen atom. As a result, it will create a greater energy difference between the alpha and beta spin state for the neighbouring proton.
Therefore, greater energy is required as a result to put the proton to resonance.
This therefore increases the chemical shift of the neighbouring hydrogen atom in a different electronic environment (i.e. different peak).
Similarly, the opposite scenario may also occur. If a proton is in the beta spin state (aligned against the magnetic field), then the neighbour proton will experience a lower effective magnetic field. Therefore, less energy is required as a result to put the neighbouring proton to resonance.
This therefore decreases the chemical shift of the neighbouring proton in a different electronic environment (i.e. different peak).
In most cases, the “N + 1” rule can be applied to determine the amount of splitting a peak may have.
The “N” refers to the number of neighbouring hydrogens in a different electronic environment.
The term ‘neighbour hydrogens’ refers to hydrogen atom that are no more than 3 chemical bonds away.
So, there are two neighbouring protons in a set of chemically equivalent proton, then the NMR peak for the set of chemically equivalent proton should be split into three, i.e. triplet.
A peak split into two = Doublet
A peak split into three = Triplet
A peak split into four = Quartet
Usually anything more than four we refer them as Multiplet.
Carbon 13 NMR
For HSC Chemistry purposes, the nature of carbon-13 NMR is quite similar to that of proton NMR.
That is, all of the principles that have learnt in proton NMR can be applied here, except for the following.
The chemical shift range displayed on the spectrum output will be greater in carbon-13 NMR compared to proton NMR. Usually, carbon-13 NMR ranges from 0 to 200ppm compared to 0 to 10 in proton NMR. This reason behind this is not required to be explained at HSC Chemistry level. For those who are interested, this discrepency has to do with the differing electron density surrounding the 1-H atom and 13-C atoms.
Regardless, what we said previously in proton NMR that a higher ppm value equates to a more deshielded atom applies here. So, in proton NMR, a higher ppm value would mean a more deshielded carbon 13 atom.
This basically means that in your unknown molecule, different carbon chemical environments would produce different signals. These signals will have different ppm value due to the nature of them being more shielded or deshielded compared to each other.
Under normal conditions, there is NO spin-spin coupling observed in carbon 13 NMR. The reason for this is because that carbon-13 is not very abundant as 99% of carbon atoms exist in the form of carbon-12 and only 1% exist in the form of carbon-13. Therefore, spin-spin coupling is basically non-existent as carbon-12 atoms are not NMR active (we talked about what qualifies an atom to be NMR active in earlier sections). In the case of proton-NMR, the 1-H atom is NMR active and it is also how 99.8% of hydrogen atoms are found. The 0.02% of hydrogen atom exist in the form of 2-H. Do note that 2-H is also NMR active as it has odd number of proton.
So, you will know that only the carbon atoms in your test molecule that are carbon-13 in nature will show signals on the NMR machine. So, why do you see peaks for carbon atoms from different carbon chemical environments? Well, this is outside the scope of what you need to know for HSC chemistry but it has to do with proton decoupling (NOT proton splitting). Through this process, hydrogen attached to carbon atoms will help generate these unique signals in carbon-13 NMR output for carbon of different chemical environments.
**The area under the signals produced in carbon-13 NMR are NOT reflective of their carbon ratio in the test molecule’s structure like how they are in proton NMR. If you remember, in proton NMR, the integration value (or the area under each signal) is reflective of the ratio of hydrogen atom in different chemical/electronic environments. However, we cannot infer this ratio using the area under the signals produced in carbon-13 NMR. One of the reason for this is due to proton decoupling taking place (which you don’t need to understand at HSC Chemistry level). If you are interested, you can read about the Nuclear Overhauser Effect which is taught at University.
**Comment: I will need to double check on this at HSC Chemistry level of whether or not students are to assume the spectra output is adjusted to allow integration to be performed accurately and successfully such that you can infer the carbon ratios from the integration value of Carbon-13 NMR signals.
<I will post update here when I have a response from NESA about if HSC students can make this assumption Last edit: 20th June 2019>
Anyhow, at the end of the day, through Carbon-13 NMR, it can help you to identify the number of different carbon environments in the test molecule’s structure. This can be useful in assisting you to verify your final molecule structure with the focus on carbon atoms.
Mass spectrometry
Mass spectrometry is particularly useful in helping us to determine the molecular mass/weight of a molecule.
What is shown below is a simplified diagram of a mass spectrometer or machine.

Step 1: A sample containing the unknown molecule is placed into the mass spectrometer.
Step 2: The sample is vapourised in a high temperature chamber whereby the
Step 3: The vapourised sample is passed a strong electrical current with 70eV (electron volts) so that an electron from the current knocks an electron from the unknown molecule converting it into a positively charged molecular ion M(g) -> M+ (g) + e–
NOTE: M+ is called a molecular cation or molecular radical cation (as it contains an unpair electron)
Step 4: The sample is passed through a negatively charged slit which causes the acceleration of charged species (e.g. the molecular ion).
NOTE: This has an effect on breaking up some of the molecular ion’s structure, each broken fragment has different molecular mass which we see as separate lines on the mass spectrum diagram.
Step 5: The molecular ion is then passed through a magnetic field in which the magnetic field of the molecular ion interacts with the applied magnetic field from the mass spectrometer.
Some of the molecular ions will pass through to the detector which helps generate the mass spectrum chart.
The heavier the broken component is (from step 3), the further to the right it will hit the detector.
The lighter the broken component is (from step 3), the further to the left it will hit the detector.
NOTE: Some of the molecular ion are broken and remains intact through to the detector as the electron break did not knock off a bonding electron (but only a core electron of an atom in the molecular ion). That is, no covalent bonds are broken.
NOTE: When a bonding electron is knocked off, the molecular ion will break into fragments. One of the fragment will be a cation (positively charged) whereas the other fragment will be uncharged (neutral), i.e. a radical. The radical will not be accelerated through the negatively charged slit and also will not have an magnetic field to interact with the applied magnetic field of the magnets. Therefore, it will not be detected by the detector and, thus, will not show up on the mass spectra. We will have a look into this soon.
Simple m/z spectrum for Benzaldehyde
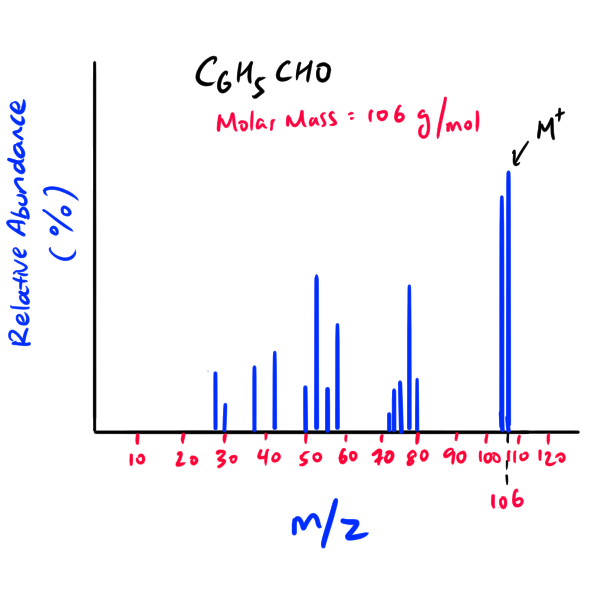
NOTE: As the charge of the molecular ion is +1, the M+ (molecular ion) m/z ratio basically informs us of the mass of the molecule.
NOTE: The M+ peak is furthest to the right of the mass spectra (highest mass to charge ratio) as the peaks on the left are broken fragments of the molecular ion.
Exception: If you see that the furthest and second furthest peak to the right have a m/z difference of one, then the furthest peak to the right would be the “M+1” peak and NOT the M+ peak. In that case, choose the second furthest peak to be your M+ peak. The difference of one is due to the isotope abundance of carbon, hydrogen, etc.
NOTE: The molecular mass of the unknown molecular ion (M+) and the original unknown molecule is essentially the same because the difference is only the mass of one electron. An electron’s mass is very small and thus is negligible.
Now let’s move on and explore some fundamentals in interpreting mass spectrometry data.
First up, let’s examine about isotopes.
It is important in mass spectrometry to know the relative abundance of the following isotopes.
The relative abundance of 35Cl : 37Cl is 3 : 1. That is, 35Cl is three times as common than 37Cl.
Recall from Preliminary Chemistry that 35Cl means denotes chlorine atom with an atomic mass of 35.
For bromine isotopes, i.e., 79Br: 81Br, the relative abundance is 1:1.
In the cases of nitrogen, oxygen and fluorine (NOF), you can say that their abundance is 100% relative to their respective isotopes (i.e. 1:0).
NOTE: The case of 12C : 13C is sort of unique. The relative abundance is ~99%:1%. Sometimes, you may see carbon-13 shown on the mass spectrum whereas in other cases, you may not. However, if you have a lot of carbon atoms in your molecule relative to other kinds of atoms, you will have a higher chance to see carbon-13 pop up in your mass spectrum.
NOTE: If your molecular ion has an odd mass to charge ratio (m/z) shown on the mass spectra diagram, it is mostly likely that it contains an odd number of nitrogen atom(s).
This is because nitrogen (14N) forms three bonds which gives molecule an odd m/z number. Compared to other atoms that have even atomic mass, they form even number of bonds. Nitrogen is an exception where it is has an even atomic mass but forms odd number of bonds.
NOTE: If you have even number of nitrogen, your molecular ion may or may not contain a nitrogen. As say you have two NH3 groups in your molecule. Each of them have an odd mass number, as NH3 has an odd mass number of 17. However, if you add them together, you will get an even number (17+17 = 34) which therefore would result in an even mass-to-charge ratio for the overall molecular ion M+)
NOTE: Furthermore, an even mass-to-charge ratio may also mean that there is no nitrogen atom in the molecular ion. Zero is treated as an ‘even’ number.
Now, in addition to all the peaks that we have looked at, there is something known as the base peak in our mass spectrum diagram. This is highest peak which therefore means it is the most abundant cation fragment (highest relative abundance of 100% to which other ions’ relative abundance is based upon). It is the most abundant because it is the most stable fragment of the all of the others. Therefore, by comparing relative abundance to the base peak, you can infer the relative stability of other fragments to the base peak fragment. Sometimes, the molecular ion is the base peak in some molecules, but it is often not the case. This is because more fragments are usually broken off that can form a more stable cation than the molecular ion (M+).
Let’s have a look at an example of this. Suppose that after using other technologies (e.g. UV-Vis spectroscopy, NMR spectroscopy and IR spectroscopy), we know that our unknown is either pentane or 2-methylbutane. Which of the following spectrum belongs to which?

Notice that both of spectrum A and B are very similar as pentane and 2-methylbutane are chain isomers.
They both have the same molecular ion peak at 72 as they have the same molecular formula and thus molecular weight. The only difference is the relative abundance of the cation fragment at 57 m/z.
Recall that we mentioned earlier that a cation fragment can be formed when the 70eV electron beam strikes a chemical bond, thus releasing an electron and breaking the covalent bond.
Comparatively, also mentioned earlier, the molecular ion is formed by the electron striking a core (inner, non-bonding) electron of an atom and thus does not break covalent bonds. So, the resulting unknown molecule only loses an electron and keep its full, original number of atoms.
If you notice, the difference between the two spectrum are at 57m/z in the diagram above. Also, the difference between 57m/z and 72m/z is a molecular mass equivalent to 15m/z.
If we refer to the m/z table that we have display earlier, a mass-to-charge ratio of 15 is a methyl group (CH3). This means that a methyl group must have been broken off the unknown molecule, forming a cation fragment with 57m/z which is picked up by the mass spectrometry machine and displayed on the mass spectra.
This means that the CH3 broken off is a radical because when you break off a neutral molecule in the mass spectrometer, one fragment will be a cation and the other fragment will be radical as we have depicted below.

The trick to fragmentation is to break off to form a molecule with a carbocation (a carbon atom that is positively charged as it has lose one valence electron).
We will explore carbocations very soon.
For now, let’s explore the case of pentane first.
It does not matter which CH3 group is broken off pentane as the pentane molecule is symmetrical.
The resulting cation molecule has a primary carbocation (the carbon is positively charged as it lose a valence electron).
The stability of carbocations are as follows:
Tertiary carbocation > secondary carbocation > primary carbocation
Hence, tertiary carbocations are more stable than primary carbocations.
The reason of this was explored before in Module 7. The fact that R groups, e.g. methyl groups, are better electron donating groups than a hydrogen atom (due to higher amount of electrons) it provides greater stability to the resulting carbocation. Some of the electrons in the sigma bond between the carbocation and the R group will be shifted towards the positively charged carbocation.
Therefore, as the number of R group increases, the greater the stability of the carbocation.
In the case of 2-methylbutane, the fragmentation will occur for the methyl group in the green-circled circle in most of the cases as it forms a secondary carbocation with two R groups. Notice that if the fragmentation occurs in the one of the red circled methyl groups, the resulting molecule cation will be a primary carbocation which is less stable and less likely to form.
So, since the fragmentation of neutral pentane forms a primary carbocation and the fragmentation of neutral 2-methylbutane molecule forms a secondary carbocation (more stable), it is more likely that Spectrum A is of the 2-methylbutane molecule. This would mean that spectrum B belongs to the pentane.
PRACTICAL EXAMPLE: Fragmenting An Organic Molecule (without oxygen and halogen)
Let’s see how we can fragment propane so that each unique carbocation will present it as a peak on the mass spectrum diagram.

So essentially, what we are doing here is exploring all the fragmentation possibilities by examining the various carbocation molecules that we can form.
NOTE: You may think about the possibilities of the CH2 carbocation. However, this is very unstable and will not show up on the mass spectrum data. In fact, in reality, CH3 may not show up too. This is because it is unstable.
So, we will expect to see 4 peaks or different signals on the mass spectrum as there are four unique carbocation fragments.
Fragmentation for organic molecules with oxygen and halogens
<WIP Section> ^
Infrared spectroscopy
Infrared (IR) spectroscopy deals with the interaction of infrared radiation with matter and the technology able to provide us with information about the functional groups and type of bonds between atoms.
However, to figure out the full molecular structure and formula of the unknown molecule, we often would need to use NMR, Mass spectrometry and/or UV-Vis alongside IR spectroscopy.
Without further ado, let’s dive into IR spectroscopy.
In order for an unknown molecule to infrared active, it must have a permanent dipole moment or a change in its dipole moment during vibration.
NOTE: In reality, chemical bonds are not rigid and they constantly vibrating in many ways! These can be in the form of stretching, scissoring, rocking, wagging, twisting.
For instance, the molecule H-Cl has a permanent dipole as chlorine atom is much more electronegative than the hydrogen atom.
Comparatively, an unsubstituted alkene such as ethylene is not infrared active as it is symmetrical and the electronegativity between carbon and hydrogen is very similar. Therefore we will not see any absorbance bands on the IR spectrum.
The principle of IR spectroscopy lies in the idea that when the applied energy’s frequency matches the vibrational energy (or frequency of bond vibration) of that an infrared active bond, the infrared active bond will absorb such frequency when hit.
In the IR spectrum, the independent variable (x-axis) measures the wavenumber (Cm-1) which has a proportional relationship with frequency of bond vibration.
Since this is a proportional relationship, the higher the frequency of bond vibration, the higher the wavenumber. Also, remember that energy is related to frequency. So, the higher the frequency of the bond vibration, the higher the vibrational energy.
It is beyond HSC Chemistry’s syllabus to learn how to derive the relationship between wavenumber and frequency of bond vibration.
However, if you are interested, the derivation can be found on ConquerHSC’s discord community.
There are two important conditions that you need to know for IR spectroscopy which is related to Hooke’s Law.
It is beyond the scope of HSC Chemistry so we are only concern of the relevant sections of the Hooke’s Law for IR spectroscopy as outlined below.
The stronger the chemical bond, the higher the vibrational energy (thus frequency of vibration) and the higher the wavenumber.
EXAMPLE: A double bond between carbon and nitrogen will be stronger than a single bond between carbon and nitrogen.
NOTE: Generally speaking, there is also a relationship where the shorter the bond, the stronger the bond.
The lower the mass of the atoms involved in the chemical bond, the higher the vibrational energy (thus frequency of vibration) and the higher the wavenumber.
EXAMPLE: A single bond between carbon and hydrogen will have a higher vibrational energy and thus wavenumber than a single bond between carbon and nitrogen. This is because nitrogen is heavier than hydrogen.
The relative absorbance (or % transmittance) which is the Y-axis of your IR spectrum is dependent on the polarity of the bond.
The higher the polarity of the bond (i.e. the more polar the bond), the stronger the signal. This means that you will see a ‘deep downward spike’ on your IR spectra. This sharp downwards signal therefore equates to a low transmittance value.
Medium signals are produced by bonds that are asymmetrical and those that have medium polarity.
Symmetric and weakly polar bonds produce weak to no observable signals. This equates to a high transmittance value.
Using the three points above, we can expect that on the IR spectra, the following bonds will have such relative absorbance or % transmittance strength
Carbonyl bonds are produce strong signals.
R-C≡N bonds produce medium signals.
H-C≡C-R bonds produce weak signals.
R-C≡C-R bonds produce no observable signals.
The following chart is provided by NESA depicting the relationship between wavenumber and the type of functional group that it corresponds to that particular number.

Source: https://syllabus.nesa.nsw.edu.au/assets/chemistry/files/sample-questions-new-hsc-chemistry-exam-2019.pdf
HSC Chemistry Infrared Spectrometer Diagram

Basically, there is a light source that hits the sample solution containing the unknown molecule. If the frequency of the infrared radiation is equal to the frequency of the bond’s vibration, it will absorb such energy.
Any remaining percentage of the unabsorbed radiation of the same frequency will be passed through monochromator.
The monochromator has a diffracting grating that separates different frequency, generating the IR spectrum diagram.
Other Patterns on IR Spectrum with Explanations
As we have seen from the IR chart that depicts the type of functional group and their corresponding wavenumber, the OH group is labelled ‘broad’ (for alcohol) or ‘very broad’ (for acids).
We will examine why this is the case.
The degree of hydrogen bonding is not the same for different molecules. Some molecules are able to undergo hydrogen bonding to a higher extent (or higher number) as they may have more hydroxyl functional group in its chemical structure.
Comparatively, some molecules only have fewer hydroxyl functional group in its chemical structure and thus such molecule form less hydrogen bond.
When an O-H bond is involved in hydrogen bonding, it is stretched which results in elongation and weakening bond strength. For such reasons, the vibrational energy and frequency is lowered and thus the wavenumber for the hydroxyl group is lowered.
Due to such stretching, the bond strength can fluctuate across a broader range of wavenumbers. In general, the higher the number of hydrogen bonds the molecule can form, the broader the range of wavenumbers the O-H functional group can have. For such reasons, carboxylic acids have broader hydroxyl group signal than alcohols. This is because two carboxylic acids can form 2 hydrogen bonds with each other with the C=O and O-H groups on each acid molecule. On the other hand, alcohols can only form one hydrogen bond with each other with the O-H group on each alcohol.
Tertiary alcohols may have bulky R group that is much larger than hydrogen atoms. This can hinder hydrogen bonding. For such reasons, tertiary alcohols may show a narrow peak (rather than a broad peak) due to lower extent of hydrogen bonding and less stretching.
Now we will move on to having a look at the effect on how a functional group that has resonance will affect its wavenumber.

By having a resonance structure, Molecule B has a bond length and strength that is intermediate between a single and double bond between the carbon and oxygen atom.
That is, the carbonyl group in Molecule B has less double bond character compared to the carbonyl group in molecule A (100% double bond character)
However, Molecule A does not have resonance and it has a double bond between the carbon and oxygen (C=O). So, the bond strength of the carbonyl group is ‘shorter’ and stronger in molecule A than in molecule B.
This means that when you placed each separately into a IR spectrometer and you compare the two IR spectra, the carbonyl group in molecule B will have a smaller wavenumber than the carbonyl group in molecule A.
NOTE: To create resonance, you will need to look out for Pi electrons.
Shortcut for spotting resonance structures: Watch out for conjugation that already exist in the molecule (alternating single and double bonds). If there is conjugation, there is resonance.
Another scenario to create resonance is when a molecule has only single double bond but it has another atom that is has and is capable of sharing its lone pair of electrons form another double bond to create resonance.
Homework Questions
Explain the possible application of inserting an opaque substance in IR spectroscopy prior to measuring the wavenumber of its infrared active chemical bonds.
True/False: The mass of the atoms involved in a infrared active bond is proportional to wavenumber. False.
True/False: The shorter the chemical bond, the stronger the bond strength and therefore the higher the wavenumber. True.